|
|
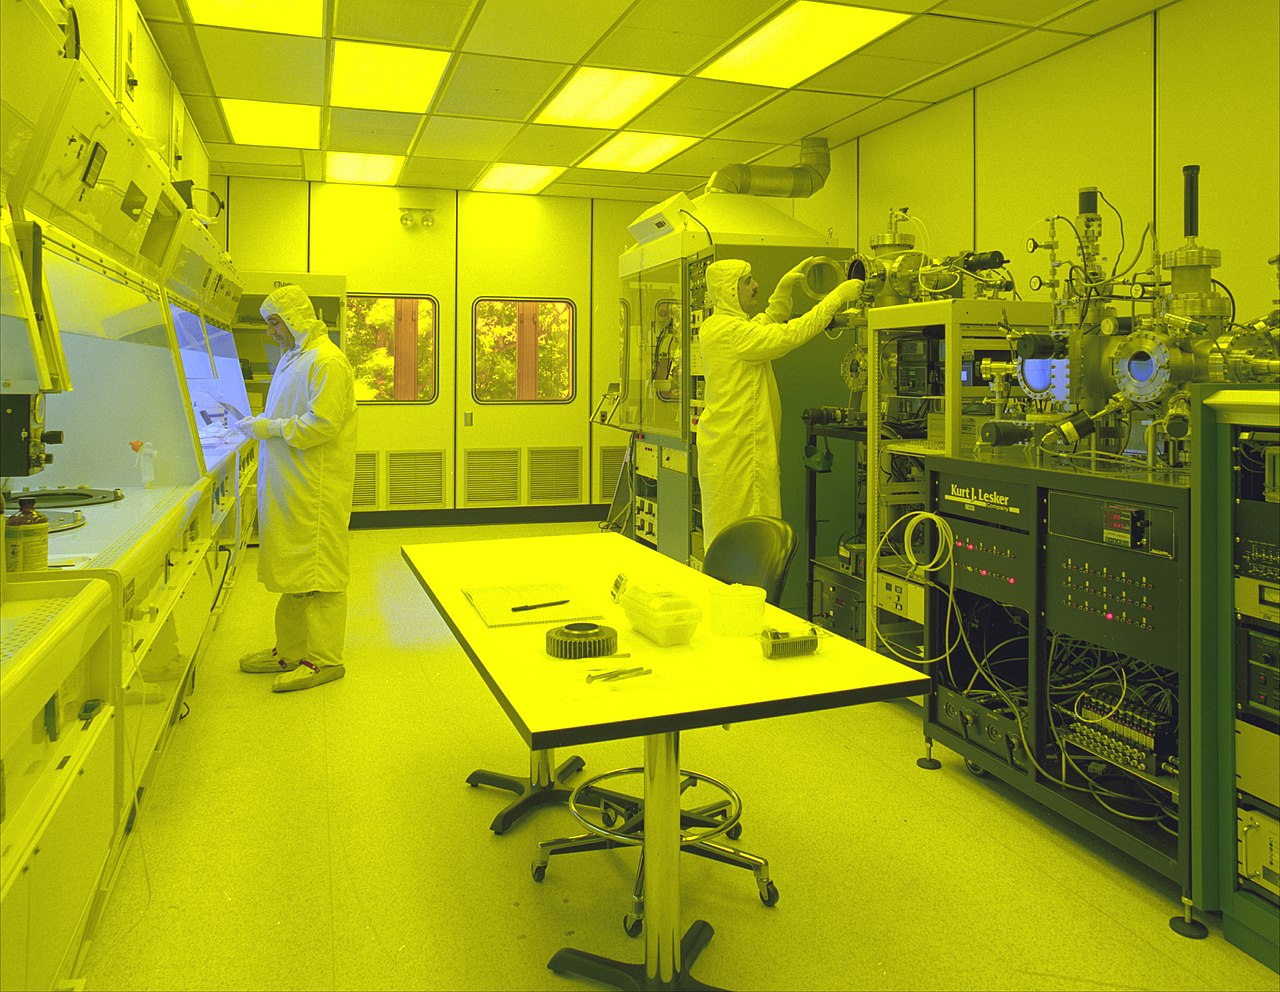
| Fig. 1: Picture of inside of a semiconductor fab. The yellow lighting is to protect the microchips from certain wavelengths of light during important processing steps. The benches on the left are often equipped with ultrapure water plumbing used for cleaning during manufacturing. (Source: Wikimedia Commons) |
Water is ubiquitous in our daily lives. It is a necessary resource that helps build roads, make clothing, grow food, provide sanitation, and most importantly it keeps us alive. Table 1 shows the breakdown of water on a global scale. We see that around 97% is saline water that makes up our oceans. Easily accessible freshwater is a very small fraction of global water supply and is available to us through lakes and rivers. The remaining freshwater is either locked away in glaciers or in the ground. On a global scale, we have about 1.062 × 10¹⁶ m3 of freshwater available. However, with increasing demand and the non-uniform access of freshwater, water scarcity is becoming a growing issue. [1]
Approximately four billion people live under conditions of severe water scarcity for at least 1 month in the year, and five-hundred million face severe water scarcity all year round. [1] Water scarcity occurs when the instantaneous supply does not meet the instantaneous demand. This mismatch is driven by geographic and temporal factors that underly water supply. Freshwater supply is not evenly distributed on the planet, while demand for water can increase at certain times of the year. The United States Geological Survey defines water use as "... to water that is withdrawn for a specific purpose, such as for public supply, domestic use, irrigation, thermoelectric-power cooling, or industrial processing". [2]
The semiconductor industry uses water to manufacture microchips that are used in nearly all microelectronic devices. Some examples of these devices include computers, smart phones, flat panel displays, sensors, and lighting (LEDs). You are reading this article on a device that has thousands of microchips in them. The facilities responsible for manufacturing these microchips are known as "semiconductor fabrication plants" or "fabs".
|
||||||||||||||||||||||||||||||||||||||||||||||||||||||||
| Table 1: Global water resources. Water is saline if it contains more than 1000 mg/L of dissolved solids. [2] The data are from Gleick. [14] |
Industries generally endeavor on enhancing energy efficiency and not water efficiency because of the immediate cost-benefit and because of government mandates. [3,4] Energy efficiency can be directly tied to the reduction of greenhouse gas emissions and is perceived to have a global impact, whereas water scarcity is seen as more of a local issue. However, as water demand is increasing it is increasingly being viewed as a potential constraint for economic growth, a threat to the health of ecosystems, and a cause for social justice. [5] The electronics (semiconductor fab) industry is a global multi-trillion dollar industry with major fabs located in Taiwan, China, the US, Europe, and South Korea. [6] Fabs are highly intensive consumers of water, both through direct water consumption, electricity usage, and throughout the lifecycle of the manufactured product. While a full assessment of the fab's water footprint requires accurate estimates of water usage through all three usage channels, in this section I will highlight direct consumption and electricity usage.
Fab "feedwater" is the term given to all direct water used by the facility. Feedwater comprises cooling water for equipment, cooling water for the HVAC systems, and ultrapure (deionized) water used to rinse microchips during manufacture. [6] Most of the water is used for rinsing the chips. An analysis conducted by Intel estimates that 97.26% of its direct water use occurs during manufacturing within their own fabs. [7] Fab feedwater impacts on water supply are correlated with where the fab is located. So, depending on the location the water use may have a greater impact on the local water scarcity.
Accounting for water usage in a fab's energy consumption means one considers the water footprint of the source of energy. This type of water usage may have a decentralized impact on the water supply. For example, if there is a coal-fired power plant 300 miles away from the location of a fab, the energy demand by the fab is tied to the water demand from the power plant. So the local watershed near the power plant is impacted.
|
|||||||||||||||||||||||||||
| Table 2: Aggregated estimated total water use in 2016 by country of 577 distinct medium to large scale fabs. This aggregate estimate represents nearly 95% of the global fabrication capacity. The data are from Frost and Hua. [6] | |||||||||||||||||||||||||||
In 2016, the total global water usage (including water for electric power) by the semiconductor industry was 2.18 × 10¹⁰ m3. [6] Table 2 lists the top five countries in terms of fab water use. To put this number into perspective and how it may influence water scarcity, let's quickly discuss China, the top consumer of water for fabrication. Fan et al. surveyed 3298 residents in 776 households from three sites in the Wei River Basin and found the per capita daily water use to be 70.2 L. [8] The population of this region is approximately 23 million. [8] Therefore, the annual human water use in this region is
| 70.2 L day-1 person-1 × 0.001 m3 L-1 × 2.3 × 107 people × 365 days year-1 | |
| = | 5.89 × 10⁸ m3 year-1 |
Thus the fab feedwater use is comparable to regional water use in China! Seeing these usage numbers side-by-side is helpful in understanding the scale of the semiconductor industry's water consumption. We will do this in a little bit more detail in the next section for the United States.
It is important to note that the data in Table 2 do not include efforts of water reclamation. Water reclamation refers to recycling practices of fabs that can lower the impacts of water scarcity. This is because they can outfit their facilities to use greywater. Greywater is relatively clean wastewater generated by baths, sinks, washing machines, and other kitchen appliances.
The semiconductor fabrication industry is relatively self-aware of its dependency on water and the issues it could pose in the future. As new fabs are being built they are increasingly likely to incorporate internal water recycling mechanisms as a means of avoiding the high cost of environmental compliance and retrofitting later on. [5] As it stands, companies typically set their own goals on the water as there are no mandates in the US restricting water use, other than to combat environmental factors such as droughts. [9]
|
|||||||||||||||||||||||||||
| Table 3: Table showing the total conterminous United States water usage, as reported by Richter et al. [12] |
Intel, a US-based semiconductor manufacturing company set its corporate environmental goals including reduction of water use per microchip below 2010 levels by 2020. [10,11] Their 2015 Corporate Social Responsibility report indicates that Intel used 3.41 × 10⁷ m3 of freshwater and 3.0 × 10⁶ m3 of greywater. [10] They estimate to have reclaimed or recycled 1.55 × 10⁷ m3 of water. The term "recycled water" here refers to the fabs using water that come from after treatments (like using greywater) and "reclaimed water" means that the fabs treat their own wastewater before discharging. [6]
In total, the conterminous United States uses 121,530 million cubic meters of water annually. [12] Richter et al. show in their study that in many areas of the United States freshwater use is exceeding the natural replenishment rate leading to abnormally low river flows, especially in Washington, Oregon, Texas, New Mexico, Idaho, California, and Arizona. [12] The study shows that low river flow threatens the local fish population, which may cause major damage to that ecosystem. [12] Their work shows that these states, among others, consume large amounts of water sourced from rivers to produce cattle-feed crops and beef. As it turns out, these states are also where many fabs are located in the US. For example, Intel has fabs in Arizona, California, New Mexico, Oregon, and Texas. [11]
If we compare the total fab water use in the US and look at some of the water it takes to grow crops, we see that they are comparable. For instance, fabs use an estimated 2.23 × 10⁹ m3 annually in the United States which is greater than the water it takes annually for any one crop of almond, potato, or barley. [12]
While energy-accounting is already a complicated subject, bringing in water-accounting adds even more complexity. The photovoltaic (PV) panels used for solar power generation are all manufactured in semiconductor fabrication plants. To accurately estimate the climate benefits of renewable energy generation its water cost should be accounted for - especially for solar PV generation. As a first step, a study conducted in 2013 by Klise et al. considered operational water use and utility-scale solar generation plants in the southwestern United States. The study mainly focuses on California as it has a favorable solar climate to maximize energy generation. [13] The study found that nine watersheds in California were of particular concern because of limited water availability. These particular watersheds were looked at because they were planned locations to build solar PV plants and concentrated solar power (CSP) plants. Water use for solar generation depends on the size and type of the plant. For PV facilities that have a nameplate generation capacity of greater than 100 MW, the total water use per year is 1.985 × 10⁶ m3 (1609 acre-feet) for operation and maintenance. I arrived at this number by summing all quantities in Fig. 11 of Klise et al.. [13] For CSP facilities, this number is 3.07 × 10⁷ m3 (24891 acre-feet), again, by summing all numbers in Fig. 12 of Klise et al. [13] Concentrated solar power facilities cost more water per joule because of the water cooling the plants require for operation.
A useful metric to consider is the amount of water consumed per amount of energy generated. The study reports for PV facilities that generate around 600 GWh/year, the yearly water consumption per joule is 68.14 L MWh-1 (18 gallons MWh-1). This number is much higher for a CSP facility of the same capacity, 5398 L MWh-1 (1426 gallons MWh-1). [13] One important point to note is the Klise et al. did not include the upstream water cost of producing each PV panel. [13] Therefore we can consider the PV water cost per energy to be an underestimate of the true water cost. To draw an analogy with cattle: this is the same as citing the water the cattle drinks, without including the water cost of the crop that is used to feed it.
In this article, we discuss water scarcity and water usage from various perspectives. As the global population increases, demand for food, freshwater, consumer electronics, and energy increases - among other necessities. We focus on the semiconductor industry's water use because it is a large presence in the global economy and of its product's ubiquity in our daily lives. This industry also manufactures photovoltaic panels, providing resources for renewable energy generation. While water is technically a renewable resource, instantaneous supply and demand underly the issues surrounding water scarcity. Meaning that we cannot continue to scale the production of water-intensive goods and services indefinitely. A sustainable approach is required. For example, we discussed that the US semiconductor industry uses around the same amount of water per year as the total US potato crop. We also discussed the water consumed per amount of energy generated for solar power plants. Carefully considering water use now will prevent ethical dilemmas in the future, such as choosing between having drinking water, food to eat, or electricity to power our homes.
© Kevin Multani. The author warrants that the work is the author's own and that Stanford University provided no input other than typesetting and referencing guidelines. The author grants permission to copy, distribute and display this work in unaltered form, with attribution to the author, for noncommercial purposes only. All other rights, including commercial rights, are reserved to the author.
[1] M. M. Mekonnen and A. Y. Hoekstra, "Four Billion People Facing Severe Water Scarcity," Sci. Adv. 2, e1500323 (2016).
[2] C. A. Dieter et al., "Estimated Use of Water in the United States in 2015," U.S. Geological Survey, Circular 1441, 2018.
[3] K. Multani, "Overview of California's 100 Percent Clean Energy Act," Physics 240, Stanford University, Fall 2020.
[4] A. Garg, "Carbon-Free Corporations: Are They Beneficial, or Even Feasible?" Physics 240, Stanford University, Fall 2020.
[5] W. Den, C.-H. Chen, and Y.-C. Luo, "Revisiting the Water-Use Efficiency Performance for Microelectronics Manufacturing Facilities: Using Taiwan's Science Parks as a Case Study," Water-Energy Nexus 1, 116 (1028).
[6] K. Frost and I. Hua, "A Spatially Explicit Assessment of Water Use by the Global Semiconductor Industry," IEEE Conf. on Technologies for Sustainability (SusTec), IEEE 8333525, 12 Nov 17.
[7] T. Cooper et al., "A Semiconductor Company's Examination of its Water Footprint Approach," IEEE Int. Symp. on Sustainable Systems and Technology, IEEE 5936865, 16 May 11.
[8] L. Fan et al., "Water Use Patterns and Conservation in Households of Wei River Basin, China," Resour. Conserv. Recy. 74, 45 (2013).
[9] A. Nagourney, "California Imposes First Mandatory Water Restrictions to Deal With Drought," New York Times, 1 Apr 15.
[10] "2015 Corporate Responsibility Report," Intel Corporation, 2016.
[11] "Corporate Responsibility at Intel," Intel Corporation, May 2020.
[12] B. D. Richter et al., "Water Scarcity and Fish Imperilment Driven by Beef Production," Nat. Sustain. 3, 319 (2020).
[13] G. T. Klise et al., "Water Use and Supply Concerns For Utility-Scale Solar Projects in the Southwestern United States," Sandia National Laboratory, SAND2013-5238, July 2013.
[14] P. H. Gleick, "Water Resources," in Encyclopedia of Climate and Weather, ed. by S. H. Schneider (Oxford University Press, 1996), Vol. 2, pp.817-823.