|
|
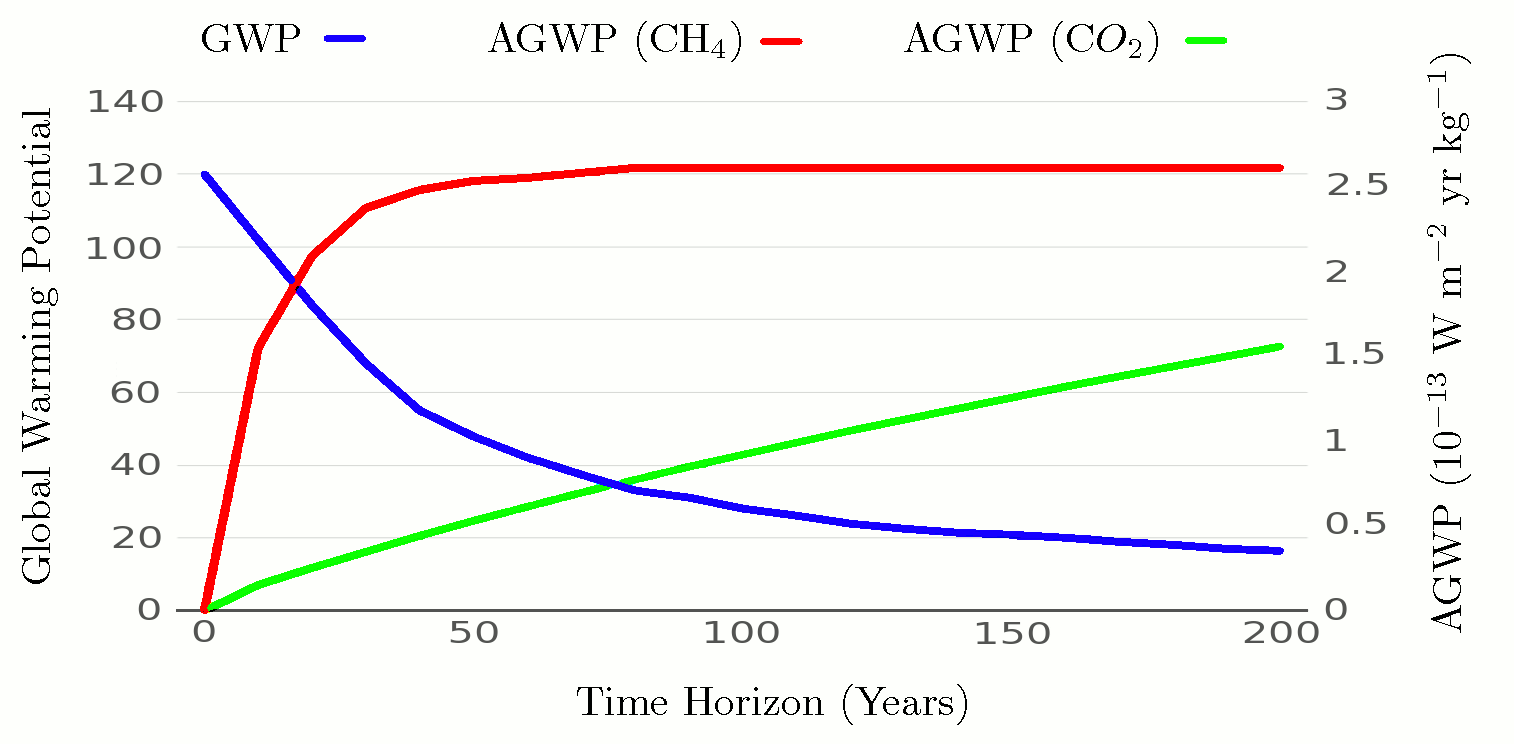
| Fig. 1: Development of AGWP-CH4, AGWP-CO2 and GWP-CH4 with time horizon. The red and green curves show how the AGWPs changes with increasing time horizon. [1] The blue curve shows how GWP, which is their ratio, falls with increasing time horizon. (Source: V. Jadhav) |
Global Warming and Climate Change, today's most-trending topic on a global scale and one of the most serious threats in mankind's history is a very extensive phenomenon and there exists a plethora of scientific parameters which can help us understand various aspects of the global warming and climate change properly. Greenhouse gas emissions, especially anthropogenic GHG emissions, are a major factor responsible for this whole issue. Now, in order to understand the "impacts" of GHG emissions on atmosphere/climate, various "metrics" are developed, studied and applied. Metrics are used to quantify the contributions to climate change of emissions of different substances and can thus act as "exchange rates" in multi-component policies or comparisons of emissions from regions/countries or sources/sectors. Metrics are also used in areas such as Life Cycle Assessments and Integrated Assessment Modelling. Global Warming Potential is one such metric. Some other examples of metrics are Radiative Forcing (RF), Global Temperature Potential (GTP) etc.
In order to understand GWP, understanding the concept of Radiative Forcing is essential. Radiative Forcing (RF) is the net change in earth's energy balance due to an enforced disruption. And, the instantaneous RF refers to an instantaneous change in net downward radiative flux (shortwave plus longwave; in W/m2) due to an imposed perturbation. This forcing is generally determined by flux changes at the top of the atmosphere (TOA) or at the climatological tropopause.
The Global Warming Potential (GWP) is defined as the time-integrated RF due to a pulse emission of a given component, relative to a pulse emission of an equal mass of CO2. Or, in other words, GWP is the ratio of Absolute Global Warming Potential (AGWP) for any component over AGWP for the reference gas CO2, where the AGWP is calculated by integrating the RF due to emission pulses over a chosen time horizon.
Thus, GWP is a "relative metric" (and not an absolute one), which compares the change due to a substance to the change due to equal amount of a reference substance, which in this case is CO2 gas. So, it is obvious that GWP for CO2 is always 1.
Table 1 gives GWP values for some gases, which are important while studying global warming and some of them are critical in ozone layer depletion.
|
||||||||||||||||||||||||||||
| Table 1: GWP values for some important
gases. [1] All values are without inclusion of
climate-carbon feedback. * The GWP values in brackets indicate the actual values obtained by taking the ratio of AGWP of gas to AGWP of CO2 over the time period under consideration. |
The choice of time scale has a strong effect on the GWP values. The GWP has usually been integrated over 20, 100 or 500 years. The GWP for a time horizon of 100 years was first adopted as a metric in the United Nations Framework Convention on Climate Change (UNFCCC) and made operational in the 1997 Kyoto Protocol. There is no scientific argument for selecting 100 years compared to other choices. The choice of time scale is a value judgement as it basically relies on where it is supposed to be applied.
Other important choices are the background atmosphere on which the GWP calculations are superimposed, and way indirect effects and feedbacks are considered. Gillett and Matthews incorporated climate-carbon feedbacks in calculations of GWP for CH4 and N2O and found that this increased the values by about 20% for 100 years. [2] Typical values after including climate-carbon feedback are: For CH4-GWP20 = 86 and GWP 100 = 34 and For N2O- GWP20 = 268 and GWP 100 = 298.
The uncertainty ranges in AGWP for CO2 were estimated to be (+or-)18% and (+or-)26% for 20 and 100 years. Reisinger et al. estimated the uncertainty in the GWP100 for CH4 to be around -30 to +40%. [3] In general, these uncertainties increase with time horizon. Also, for shorter-lived gases, the uncertainties in GWPs are larger.
The confidence in the ability to provide useful metrics at time horizons of several centuries is very low because of nonlinear effects, large uncertainties for multi-century processes and strong assumptions of constant background conditions. Thus, IPCC's AR5 considers time zones up to 100 years (unlike AR4, which included GWP values for 500 years as well). Though, these time scales are significant for gases like CO2, SF6 and PFCs. For CO2, about 20-40% of the initial increase in concentration remains after 500 years. For PFC-14, 99% of an emission is still in the atmosphere after 500 years.
The most important application of GWP is to calculate contributions of CO2 equivalent emissions by any component, sector or nation.
Also, metrics do not define goals and policies;they are tools that enable evaluation and implementation of multi-component policies. So, GWP may or may not be the most appropriate metric for a policy depending on which aspects of climate change are most relevant to a particular application.
A direct interpretation of GWP is that it is an index
of the total energy added to the climate system by a component in
question relative to that added by CO2
The GWP values, like all metric values, need periodic
updating due to changing atmospheric conditions as well as improved
input data. © Vijaysinh Jadhav. The author grants permission
to copy, distribute and display this work in unaltered form, with
attribution to the author, for noncommercial purposes only. All other
rights, including commercial rights, are reserved to the author. [1] G. D. Myhre et al.,
"Anthropogenic and Natural
Radiative Forcing," in Climate Change 2013: The Physical Science
Basis. Contribution of Working Group I to the Fifth Assessment Report of
the Intergovernmental Panel on Climage Change, ed. by T. F. Stocket
et al. (Cambridge University Press, 2013). [2] N. P. Gillett and H. D. Matthews, "Accounting
For Carbon Cycle Feedbacks in a Comparison of the Global Warming Effects
of Greenhouse Gases," Environ. Res. Lett. 5, 034011 (2010). [3] A. Reisinger, M. Meinshausen, and M. Manning,
"Future Changes in Global Warming Potentials Under Representative
Concentration Pathways," Environ. Res. Lett. 6, 024020 (2011).References