|
|
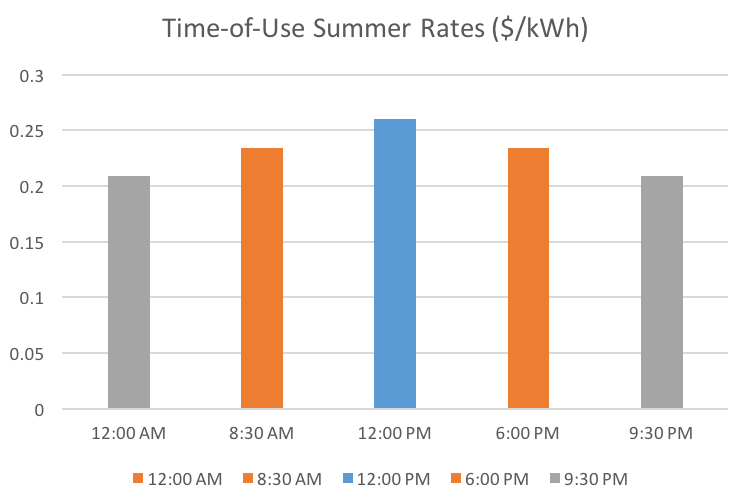
| Fig. 1: An example of Time-of-Use pricing. [1] (Source: C. Furrer) |
Elon Musk has changed the world through his groundbreaking businesses of SpaceX, Solar City, and Tesla Motors. Each of these ventures pursues a radical plan and attempts to redefine the possible at every turn. Although each company in Elon Musk's portfolio is revolutionary, this paper will focus on a very specific, but critical aspect of Musk's grand vision: The Tesla Powerwall.
While not as explosive as a rocket launch and less glamorous than Tesla roadster, the Tesla Powerwall has the potential to redefine the possibilities of small-scale renewable energy by making a large, efficient battery available for mass-market consumption. The uses for the Powerwall are many - ranging from storage of excess solar power generated by your home to quickly charging your Tesla Roadster. However, of all the possibilities for the Powerwall, none is more interesting than the potential for time of use load shifting. Essentially, time of use load shifting refers to the ability to draw electricity from the grid in low-demand periods of the day in order to reduce grid-dependency in high-demand hours.
To understand the potential for savings and reduced grid-dependency, consider the pricing structure in Fig. 1. Published publicly by Pacific Gas and Electric and cited for permanence in Biviji et al., the graph reflects the cost in dollars per kWh of electricity for a residential customer depending on the time of day. [1] As you can see, customers under contract with this pricing model would benefit from charging their Powerwall from the hours of twelve AM to eight thirty AM, in order reduce the amount of electricity they use when demand is highest - that is, from noon to six PM. However, is the potential to save money worth the cost? Is the Tesla Powerwall economical for most homes? Ultimately, the answer depends on where you live and the specifics of your contract with the electricity company.
In order to determine whether or not the average American family can save money by purchasing the Tesla Powerwall 2, we have to figure out when the investment in a Powerwall begins to pay for itself. To do this, we have to make a number of assumptions about what exactly constitutes an average American family and how they might use the Powerwall. First, we must understand the technical specifications of the Powerwall 2 itself. Second, we need to make assumptions about the electricity pricing structure that our typical American family has access to. Finally, we need to combine all of these assumptions into a model that allows us to determine whether or not it would be economical for an average American family to buy the Powerwall 2.
The full technical specifications as published by Tesla and reported by Wired Magazine are as follows: [2,3]
Energy: 14 kWh
Power:7 kW peak
Warranty: Unlimited cycles for up to 10 years
The main thing that matters to us is the Energy and Power specifications. According to Tesla, this tops off at 14 kWh of Energy stored and 7 kW of Power. This means that the Powerwall 2 can supply 14 kWh of electricity, with a peak output of 7 kW. Also crucial to our calculations is the warranty on a Powerwall unit. Because batteries steadily lose efficiency over their lifetime, Tesla's guarantee for ten years means that we can assume the Powerwall will be very inefficient after ten years. This means we must try to recoup our costs that 10-year period covered by warranty, otherwise our assumptions will be incorrect due to the diminishing returns of the battery.
Now that we understand the Energy and Power capabilities of the Powerwall 2 unit, we must examine its potential to be used by an average household. According to the EIA, the American family consumes an 901 kWk of electricity per month. Assuming there are 30 days each month, we can say the American family consumes 30.03 kWh of electricity per day. This 30.03 kWh average is 2.15 times as much Energy as the Powerwall 2 unit can provide assuming a full charge. However, while battery and the average energy use in a household are important to our model, they do not have nearly as great an effect on the outcome as the contract the household has with their electricity company.
|
||||||||
| Table 1: Time-of-Use rates for PG&E customers [1] |
Unfortunately, the United States is a big place, and there are hundreds of electricity providers that all serve customers different pricing models at different price ranges. This greatly complicates our ability to extrapolate onto the average household, because an average consumer in Texas has a vastly different price per kWh than a consumer in Hawaii. [1] However, while differing in price, the pricing models that electricity companies provide tend to come in just two flavors: either a Time-of-Use plan or an average rate plan. Time-of- Use plans work as we have already discussed - with changing prices depending on the time of day and season that the electricity is used. Average rate plans simply adjust prices to reflect a seasonal or monthly average and then charge consumers that flat rate regardless of when they use the electricity. Unfortunately, It's not economical for consumers of average rate plans to purchase a Powerwall 2 unit because time of use load shifting has no significant effect on the price you will pay for electricity. Therefore, we will focus on those remaining Americans that have Time-of-Use plans in our model.
Although many Americans have similar Time-of-Use plans for their electricity, the plans can vary widely in price state by state. In order to settle on an average model, we will take the percent increase in price per kWh of a single Time-of-Use plan and apply it to the average price paid per kWh of electricity for each state. Because I'm writing this in the Bay Area, we'll use the Time-of-Use plan offered by the Bay Area's largest utilities provider, Pacific Gas and Electric. The rates can be seen in Table 1.
|
||||||||
| Table 2:Percent Increase Per Demand Period Relative to State Average $/kWh. [1] (Source: C. Furrer) |
Now we will examine how our average American family under a Time-of-Use plan could use a Tesla Powerwall 2 to save money on electricity. First of all we know they would have to recoup the cost of the unit in 10 years before the warranty expires. This means that they would have to save at least $6,500 [2] on electricity through the time of use load shifting offered by the Powerwall 2. Let's assume that a family uses most of their 30 kWh of electricity in Peak hours and the least in Off-Peak. Next, we'll guess that before buying the Powerwall 2, our average family draws 14 kWh during Peak hours, 10 kWH during Partial-Peak hours, and the remaining 6 kWH during Off-Peak hours. If these assumptions hold, then the optimal time of use load shifting strategy would be to charge the 14 kWh battery at night, paying the Off-Peak price for electricity, and then use it during the Peak hours of noon to six PM. A family following this "optimal" strategy would now consume 20 kWh of electricity in Off-Peak hours and 6 kWh of electricity during Partial-Peak periods.
To determine how much a family following this strategy could save, we will assume that the average price of electricity by state is the average of Off-Peak electricity price and Partial-Peak electricity price. This is very accurate for the state of California and the PG&E plan: The average cost of electricity in California is $0.188 per kWh and the average of Partial-Peak and Off-Peak prices from May-October is exactly $0.188 per kWh. [4] The evidence of this accuracy is seen in Table 2, where the Off-Peak and Partial-Peak price both vary by exactly 20.2% off the baseline average for California.
We can now calculate the yearly cost of electricity for a family consuming 6 kWh Off-Peak, 14 kWh Peak, and 10 kWh Partial Peak for the entire year for each state average, A.
| Cost Per Day | = | (6 kWh ×(1 - 0.202) + 14 kWh × (1 + 0.819) + 10 kWh × (1 + 0.202)) × A |
| = | 40.72 kWh × A | |
| Cost Per Year | = | 365 days/year × Cost Per Day |
In California A = $0.188 per kWh, which gives a cost per year of $0.188 kWh-1 × 40.72 kWh day-1 × 365 days year-1 = $2792.20 year-1.
We will now calculate the yearly cost of electricity for a family consuming 20 kWh Off-Peak, 0 kWh Peak, and 10 kWh Partial Peak for the entire year for each state average, A.
| Cost Per Day | = | (20 kWh × (1 -.202) + 0 kWh × (1 + 0.819) + 10 kWh × (1 + 0.202)) × |
| = | 27.98 kWh × A | |
| Cost Per Year | = | 365 days/year × Cost Per Day |
This means that in California, the cost Per year using our PowerWall 2 strategy would be $0.188 kWh-1 × 27.98 kWh day-1 × 365 days year-1 = $1919.98 year-1.
Overall, a person in California buying a Powerwall 2 unit and following our "optimal" strategy would save $2792.20 - $1919.98 = $872.22 per year. Over 10 years, this translates to $8722.20 in savings. When considering the $6,500 price of the Powerwall 2, you would profit $2,222.20, a healthy improvement. Overall, this model can be simplified down to:
| Savings | = | $6500 - 10 years × 365 days per year × (40.72 kWh/day - 27.98 kWh/day) × A |
| = | $6500 - 46501 kWh × A |
Through some basic algebra, we see that in order to break even, we can input a savings of 0 and solve for the Average, A. This shows us that in order to break even, you must have an average state cost of at least $0.139 per kWh.
In conclusion, our model shows that if you live in a state with an average electricity cost of at least $0.139 per kWh and can change to a Time-of-Use pricing model of similar value to the PG&E examined here, you could at least break even by purchasing a Tesla Powerwall 2. This result is surprising to me, because most of the populous urban centers in the US pay prices above our minimum to break even, and since the majority of Americans live in places like these, it would be profitable for them to buy a Tesla Powerwall 2 unit for their homes.
While this model can be accurate in some cases, there are a few flaws that I deem necessary to acknowledge. First of all, the model extrapolates PG&E's Time-of-Use Summer schedule to the entire year, when in fact there is a separate Time-of-Use schedule for some parts of the Winter. Furthermore, my model does not take into account possible maintenance costs such as battery failure. While this would be covered under warranty for the ten years Tesla guarantees, it would adversely affect the Powerwall 2's money saving ability because the battery would be unusable for possibly long periods of time while parts were shipped and maintenance workers called, etc.
© Charlie Furrer. The author grants permission to copy, distribute and display this work in unaltered form, with attribution to the author, for noncommercial purposes only. All other rights, including commercial rights, are reserved to the author.
[1] M. Biviji et al., "Patterns of Electric Vehicle Charging with Time of Use Rates: Case Studies in California and Portland," IEEE 6816454, 19 Feb 14.
[2] J. Stewart, "Tesla Unveils Its New Line of Camouflaged Solar Panels," Wired, 28 Oct. 2016.
[3] "Powerwall 2 AC," Tesla, November 2016.
[4] "Electric Power Monthly with Data for August 2016," U.S. Energy Information Administration, October 2016.