|
|
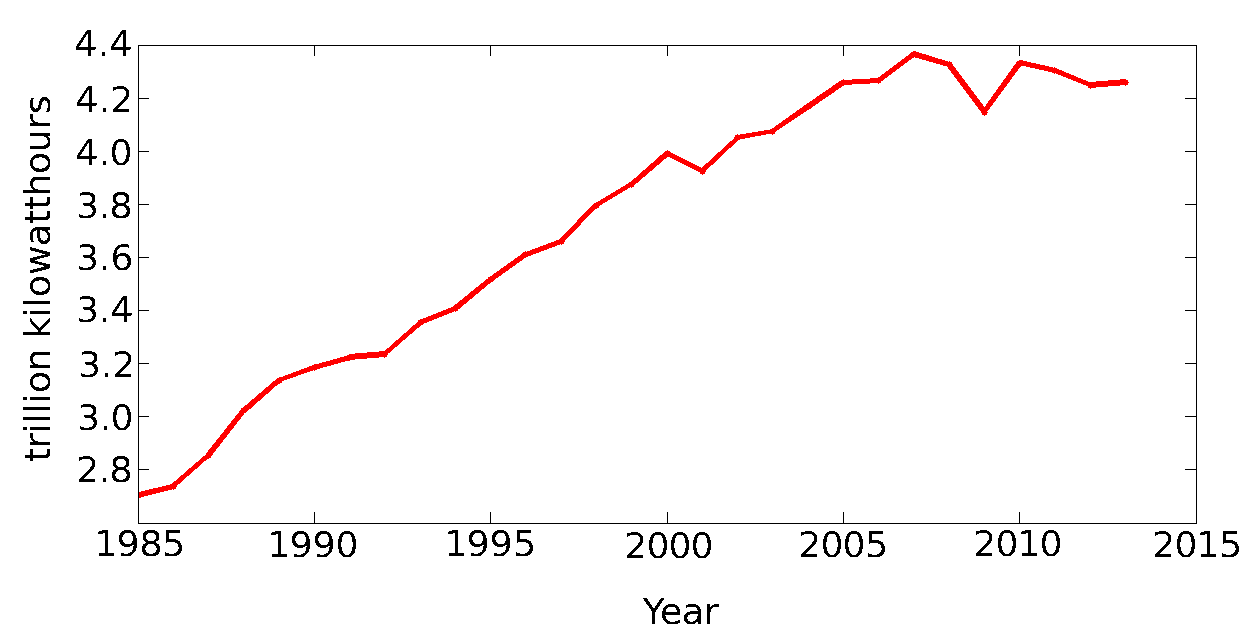
| Fig. 1: Historical US Electricity Generation. [1] |
Electricity is a type of energy application, we use it every time we plug into an outlet. Since it is a form of energy, the amount of electricity consumed or generated can be expressed in terms of joules, which is a unit of energy. The typical unit for electricity consumption found in utility bills is kWh or kilowatt-hour. This can be converted to energy units because a kilowatt is a unit of power or the rate of energy used over time (kilojoule/second). Thus, multiplying power (energy/time) with time results to the total energy used. One kWh is equivalent to 3,600,000 joules.
The historical electricity generation for the United States (US) is shown in Fig. 1. US electricity generation steadily increased from 1985 to 2007 before it decreased from 2007 to 2009. After 2009, it increased slightly before it flattened out. Globally, the United States was the second largest electricity generator in the world in 2013 with a total generation of 4260 TWh (18 percent of the world total). [1] In comparison, China had the highest generation in 2013 with 5362 TWh (23 percent of the world total). [1]
 |
| Fig. 2: 2012 US Electricity Generation Distribution by Energy Source. [2] Other renewable energy technologies used were solar, wind, biomass, and geothermal. Other oil and gas include petroleum liquids, petroleum coke, furnace gas, and waste gas. Others include municipal solid waste, batteries, hydrogen, steam, and other miscellaneous sources. |
Given the size of the US electricity market, it plays an important role in the global CO2 emissions conversation. Furthermore, power plants are large-scale point sources for CO2. Thus, from a policy perspective, it is easier to create a significant immediate impact on emissions reduction in the electricity sector compared to the transportation sector. As government entities and international organizations continue to craft policies to reduce CO2 emissions, it is important to look at the actual numbers to develop pragmatic solutions. The goal of this report is to look at the different US electricity sources and their corresponding CO2 emissions. An initial approximation of the amount of CO2 emissions is calculated to help guide conversations surrounding electricity generation and emissions reduction.
The distribution of energy sources for the US electricity generation in 2012 is shown in Fig. 2. In summary, the main electricity sources are coal, natural gas, and nuclear. Coal contributed 37 percent, followed by natural gas and nuclear at 30 percent and 19 percent, respectively. [2] Among the different renewable energy technologies, hydroelectric power had the most impact at 7 percent. [2] Since the top four sources comprised 94 percent of the total electricity production, CO2 emissions were calculated for these.
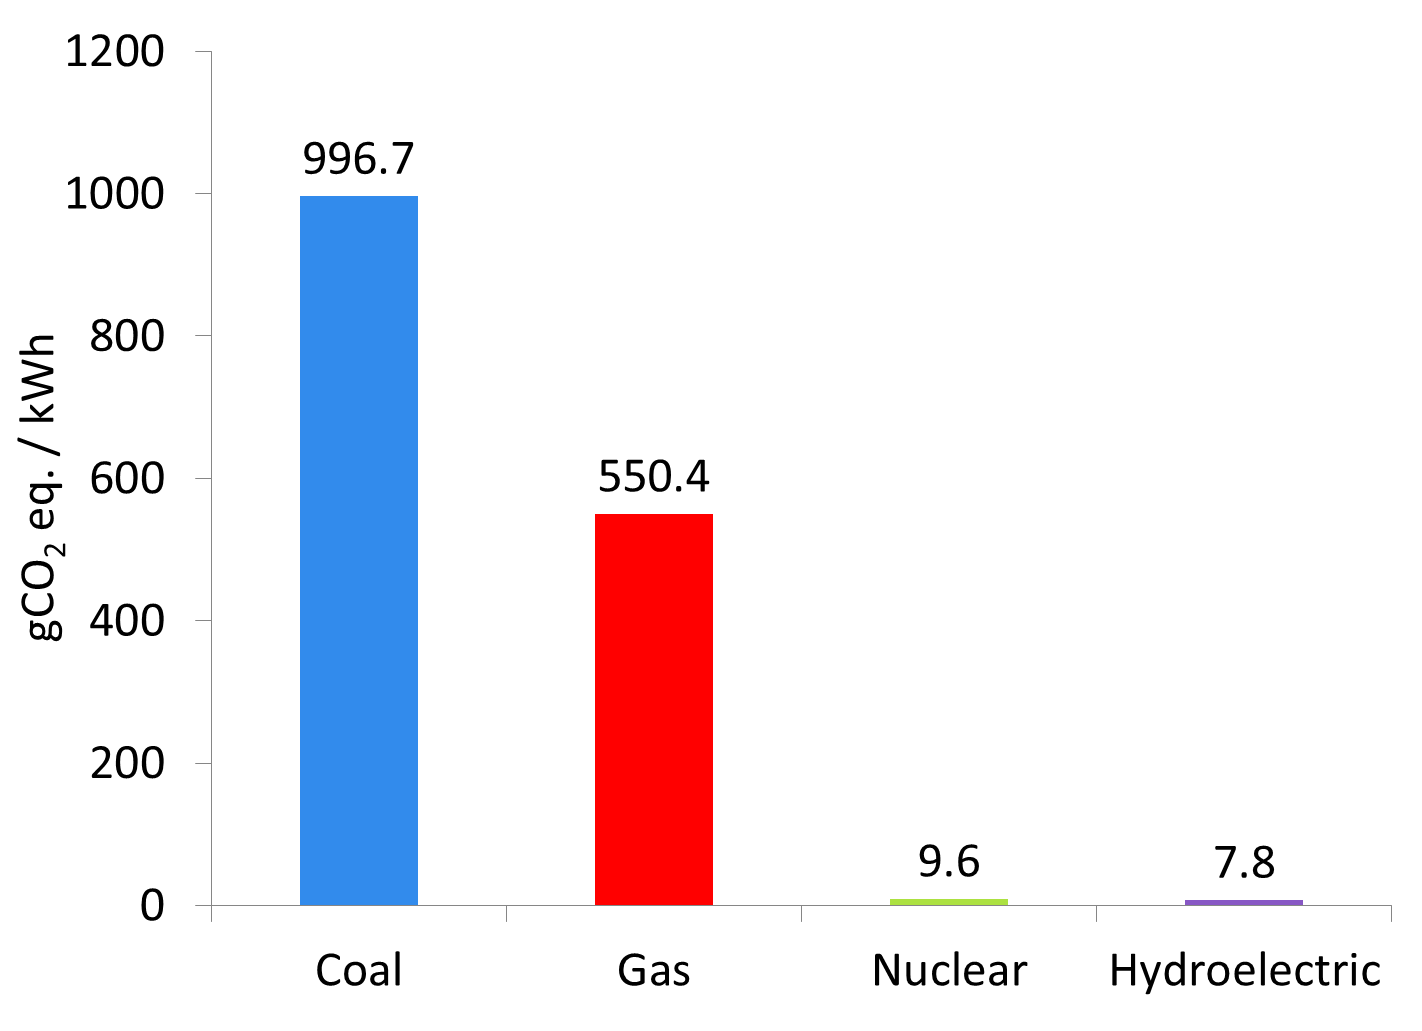 |
| Fig. 3: Life-cycle Greenhouse Gas (GHG) Emissions for Different Electricity Sources (mean values). [3] |
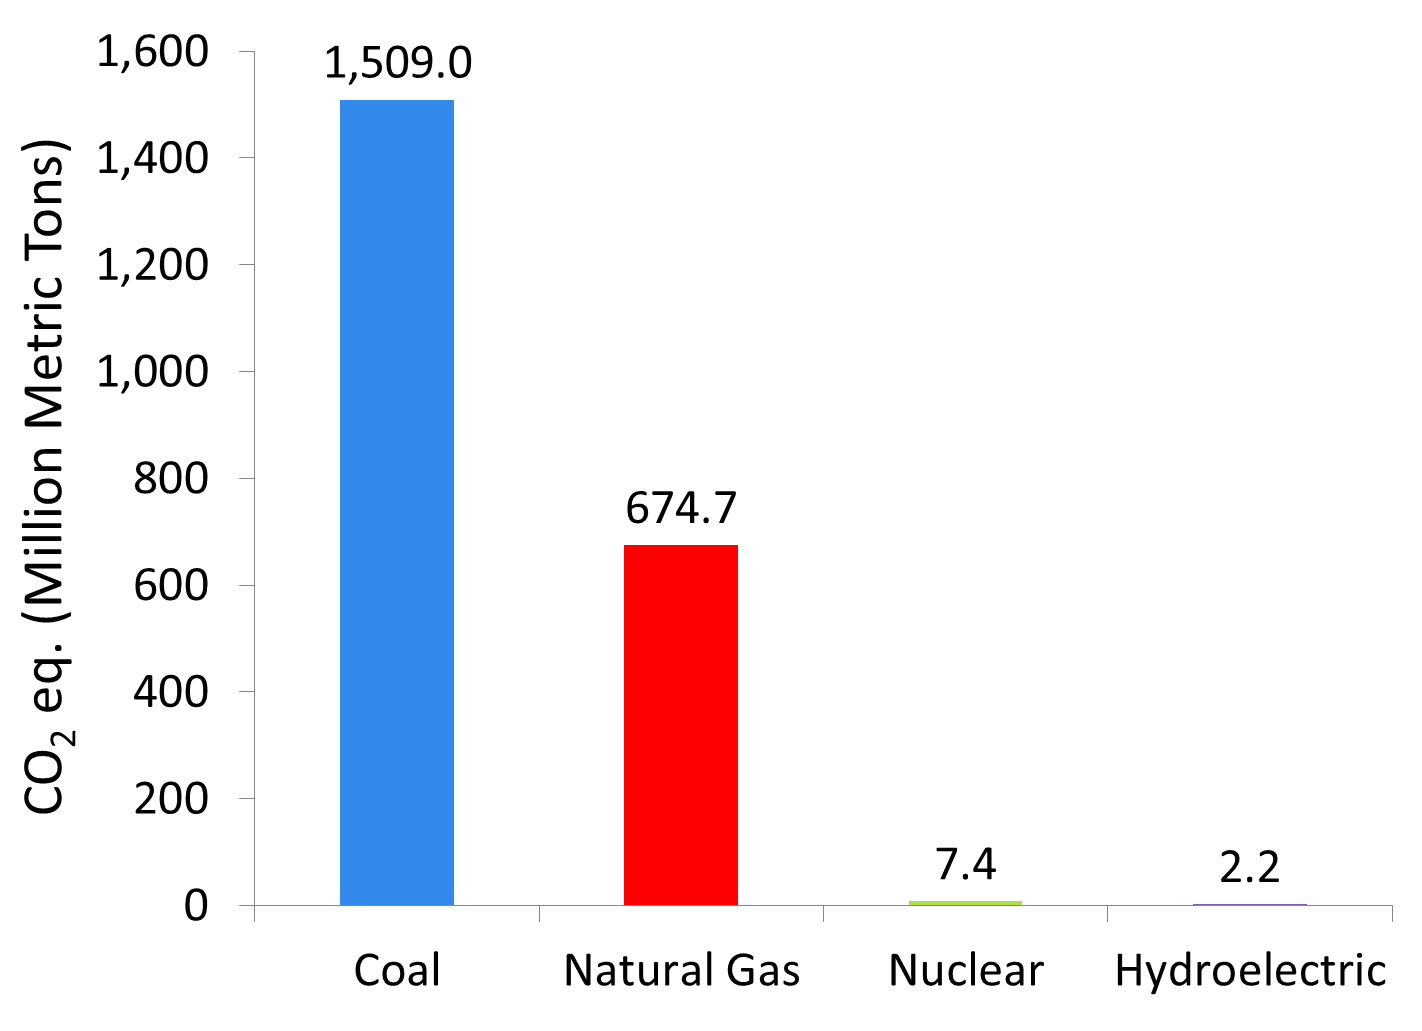 |
| Fig. 4: 2012 US Electricity CO2 Emissions by Energy Source. [2,3] |
The CO2 emissions factor is the total mass of equivalent CO2 produced per unit of energy generated. Emissions of other gases can be converted to the equivalent CO2 emissions by adjusting for the global warming potential. In order to quantify and compare the total CO2 emissions factor for the different energy sources, the life-cycle analysis (LCA) method can be used. For the LCA method, the total CO2 emissions of a system is divided by the total energy produced. Total CO2 emissions include those from the initialization, operation, and decommissioning phases of power plants. The total amount of CO2 emitted depends on various parameters such as the fuel type, fuel transportation method, fuel technologies, power plant configuration, location, and waste disposal methods. [3] Because of the significant number of possible combinations of these parameters, there is a great variation in reported CO2 emissions factor values. [3] For simplicity, the average life-cycle CO2 emissions factor for the different energy sources are used (Fig. 3). Among these four, coal has the highest CO2 emissions factor while hydroelectric power has the lowest. CO2 emissions from coal and natural gas plants are mainly from the operation phase. [3] In addition, significant emissions for natural gas can come from leakages during transport. [3] On the other hand, CO2 emissions for hydroelectric power are from the construction and operation of the power plant. [3] One key observation is that natural gas produces 45 percent less CO2 emissions compared to coal for the same amount of energy.
Using the mean CO2 emissions factor from Figure 3 and the amount of energy produced in 2012, the total CO2 emissions for coal, natural gas, nuclear, and hydroelectric in 2012 were calculated (Figure 4). Because of its high CO2 emissions factor, coal contributed approximately 70 percent to the total CO2 emissions although it only contributed 37 percent to the total electricity produced in 2012. Because natural gas produces less CO2 compared to coal, converting coal to natural gas could significantly reduce CO2 emissions while producing the same amount of electricity. For instance, if 50 percent of the electricity produced from coal in 2012 were converted to natural gas, 338 million metric tons of CO2 emissions would have been avoided. Given the cheap price of natural gas in the US and the difficulty of dramatically increasing the share of electricity production from renewable energy sources, converting from coal to natural gas would be a more pragmatic approach to reducing CO2 emissions in the short term. [4]
© Carla Co. The author grants permission to copy, distribute and display this work in unaltered form, with attribution to the author, for noncommercial purposes only. All other rights, including commercial rights, are reserved to the author.
[1] "BP Statistical Review of World Energy," British Petroleum, June 2014.
[2] "Electric Power Annual 2012," U.S. Energy Information Administration, December 2013.
[3] D. Weisser, "A Guide to Life-cycle Greenhouse Gas (GHG) Emissions from Electric Supply Technologies," Energy 32, 1543 (2007).
[2] T. Puko and C. Berthelsen, "Natural-Gas Prices Drop on Greater-Than-Expected Surplus," Wall Street Journal, 10 Jul 14.